Build the chart in six steps
- Create date and morning-weight columns.
- Enter one standardized reading per chosen day.
- Leave missing measurements empty; do not invent them.
- Calculate a mean as sum divided by recorded days.
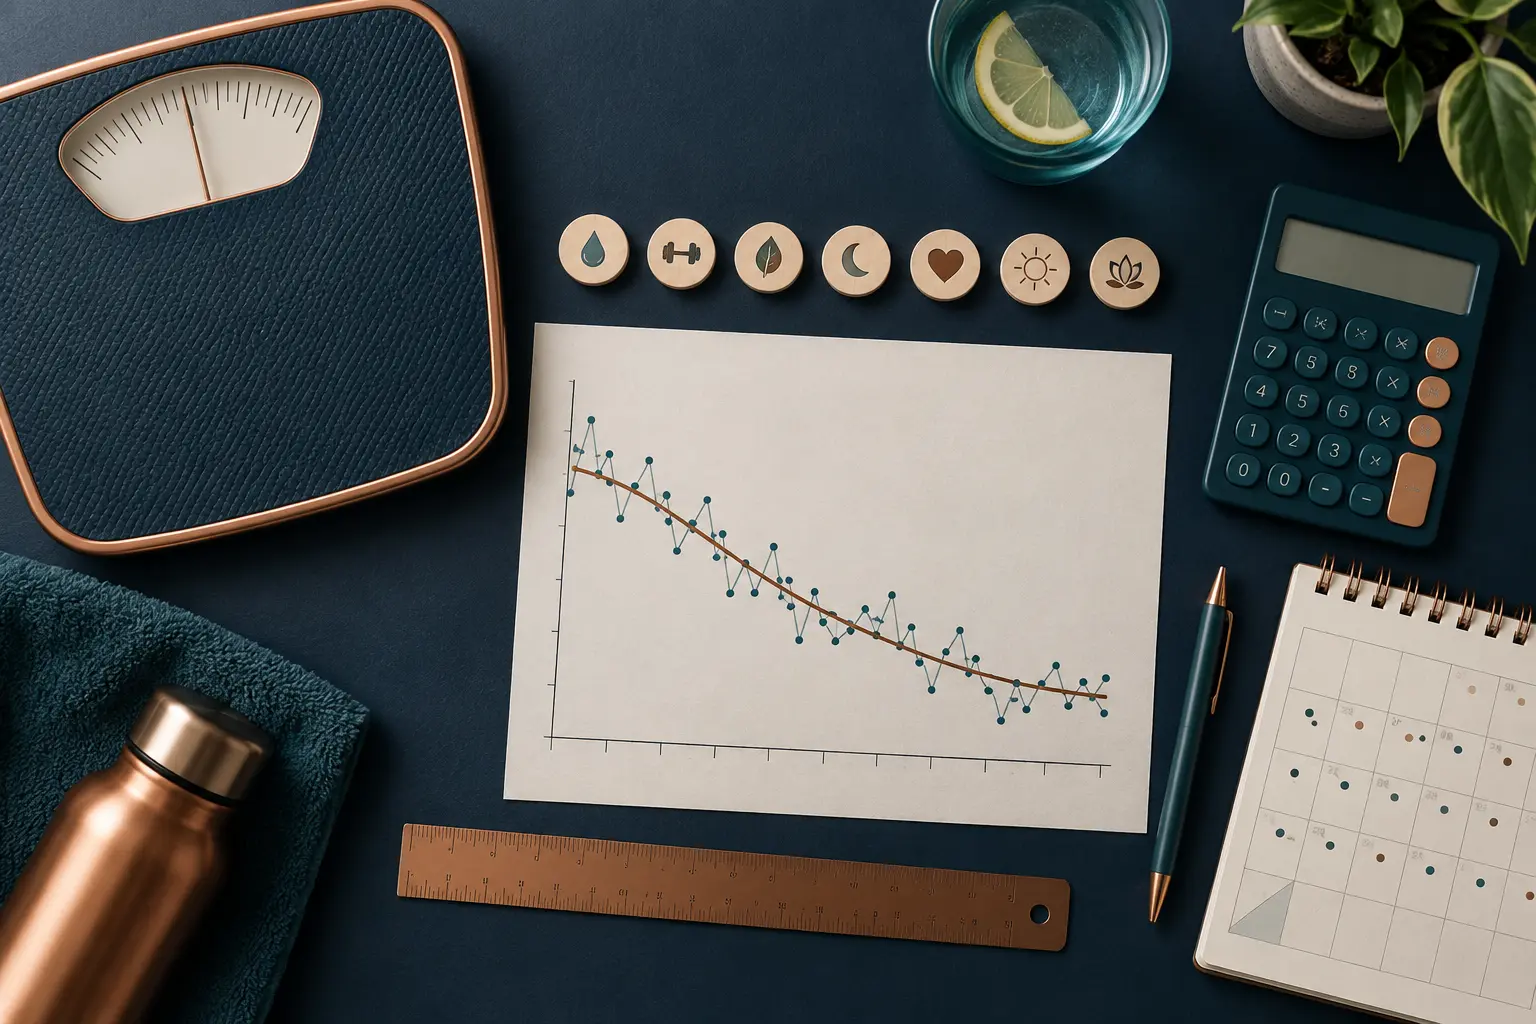
- Plot raw points and a weekly-average or rolling-average line.
- Add brief event markers and a scheduled review date.
A calendar-week average is easy to compare. A rolling average updates daily but overlaps heavily with the prior point. Label which method you use and do not switch methods to obtain a preferred result.
Read slope and uncertainty together
A downward summary line suggests total weight is declining; it does not quantify fat alone. A flat segment may be normal noise, a genuine plateau, or inconsistent execution. Inspect waist, adherence, sodium, training soreness, digestion, and the length of the segment before deciding.
Keep a reasonable vertical scale. Cropping the axis tightly can make a small fluctuation look dramatic. Exporting every decimal does not make the underlying biology more precise.

Tools for building the chart
A simple spreadsheet is enough. Use one column for the date, one for weight and one for notes. Most spreadsheet programs can add a seven-day moving average with a single formula and draw a line chart. Many smart scales and phone apps also calculate trends automatically; make sure you know which averaging method they use.
Reading an example chart
Imagine daily readings that bounce between 80.4 and 81.6 kg for two weeks. The raw dots look chaotic, but the weekly averages read 81.2, then 80.9, then 80.6 kg. That is a steady loss of about 0.3 kg a week. A single high reading after a salty meal sits above the line and falls back within days, which the average shows clearly.
Turning the chart into decisions
- Average falling at your target pace: keep the plan.
- Average flat for three to four weeks with consistent habits: reduce intake slightly or add activity, one change at a time.
- Average falling faster than about 1% of body weight per week: consider eating more, especially protein.
- Average rising during maintenance: review portions, alcohol and activity before it grows.
Stop or simplify tracking if it causes anxiety, repeated weighing or compensatory restriction.
Where a supplement fits
A trend chart is the only fair way to judge any change, including a supplement. Short-term water shifts from stimulants or sweating can mislead single readings.
Once the practical steps in this guide are working, decide whether an optional supplement adds enough value. Start with the Fat Burn Active review; if the formula and limitations are acceptable, see the current price on the official site. We may receive a commission.
Frequently asked questions
Should missing days be filled in?
No. Leave them blank and label averages by the number of actual observations.
Rolling or weekly average?
Either works when used consistently; rolling points overlap, while complete weeks are easier to compare.
Can the chart show fat loss?
It shows total weight trend. Waist, function, and body-composition context improve interpretation.
Sources
- NIDDK Body Weight Planner
- CDC: Steps for Losing Weight
- Daily self-weighing behavioral intervention
- Systematic review of self-weighing
- NIDDK: Choosing a Safe and Successful Weight-loss Program
Sources reviewed September 17, 2026. This article is general educational information, not medical advice, diagnosis, or treatment.